Data Analysis for Electrochemical Impedance Spectroscopy
Application examples
Temperature-dependent conductivity measurements
Investigation of battery components
Investigation of the differential double layer capacity in systems with ionic liquids
Impedance spectroscopy of dye solar cells
A great advantage is the ability to read data formats of varying measuring devices as well as the elegant
and fast evaluation of numerous series of measurements with many spectra.
Features
Robust customizable fitting algorithms
Autofit-function for quickly fitting arbitrary models without parameter initialization
Parameter-initialization from shapes (i.e. semicircles) drawn into a spectrum
Monte-Carlo based estimation of fit parameter uncertainties
Parameter influence tester showing the impact of each parameter on the fit
Import of arbitrary, column-based text files using an easy-to-use wizard
Native support of numerous impedance data formats
Arbitrary number of spectra per project
Storage of metadata for each spectrum
Editing of the raw impedance data
Ability to use dielectric spectra, given in, e.g., permittivity and with unknown cell geometry
Within one project, spectra can be assigned to various, arbitrary equivalent circuits
Circuit-Screening tool supporting the selection of suitable equivalent circuits
Visualization of data and fit results in impedance, admittance or capacitance representations in
Nyquist
or Bode plots (customizable)
Ability to show multiple different plots (i.e. Nyquist and Bode) at the same time.
Live-analysis views that automatically show, i.e., DRT or Kramers-Kronig tests while browsing
spectra
Side-to-side comparison (overlay) of multiple spectra
Template-based graph style customization
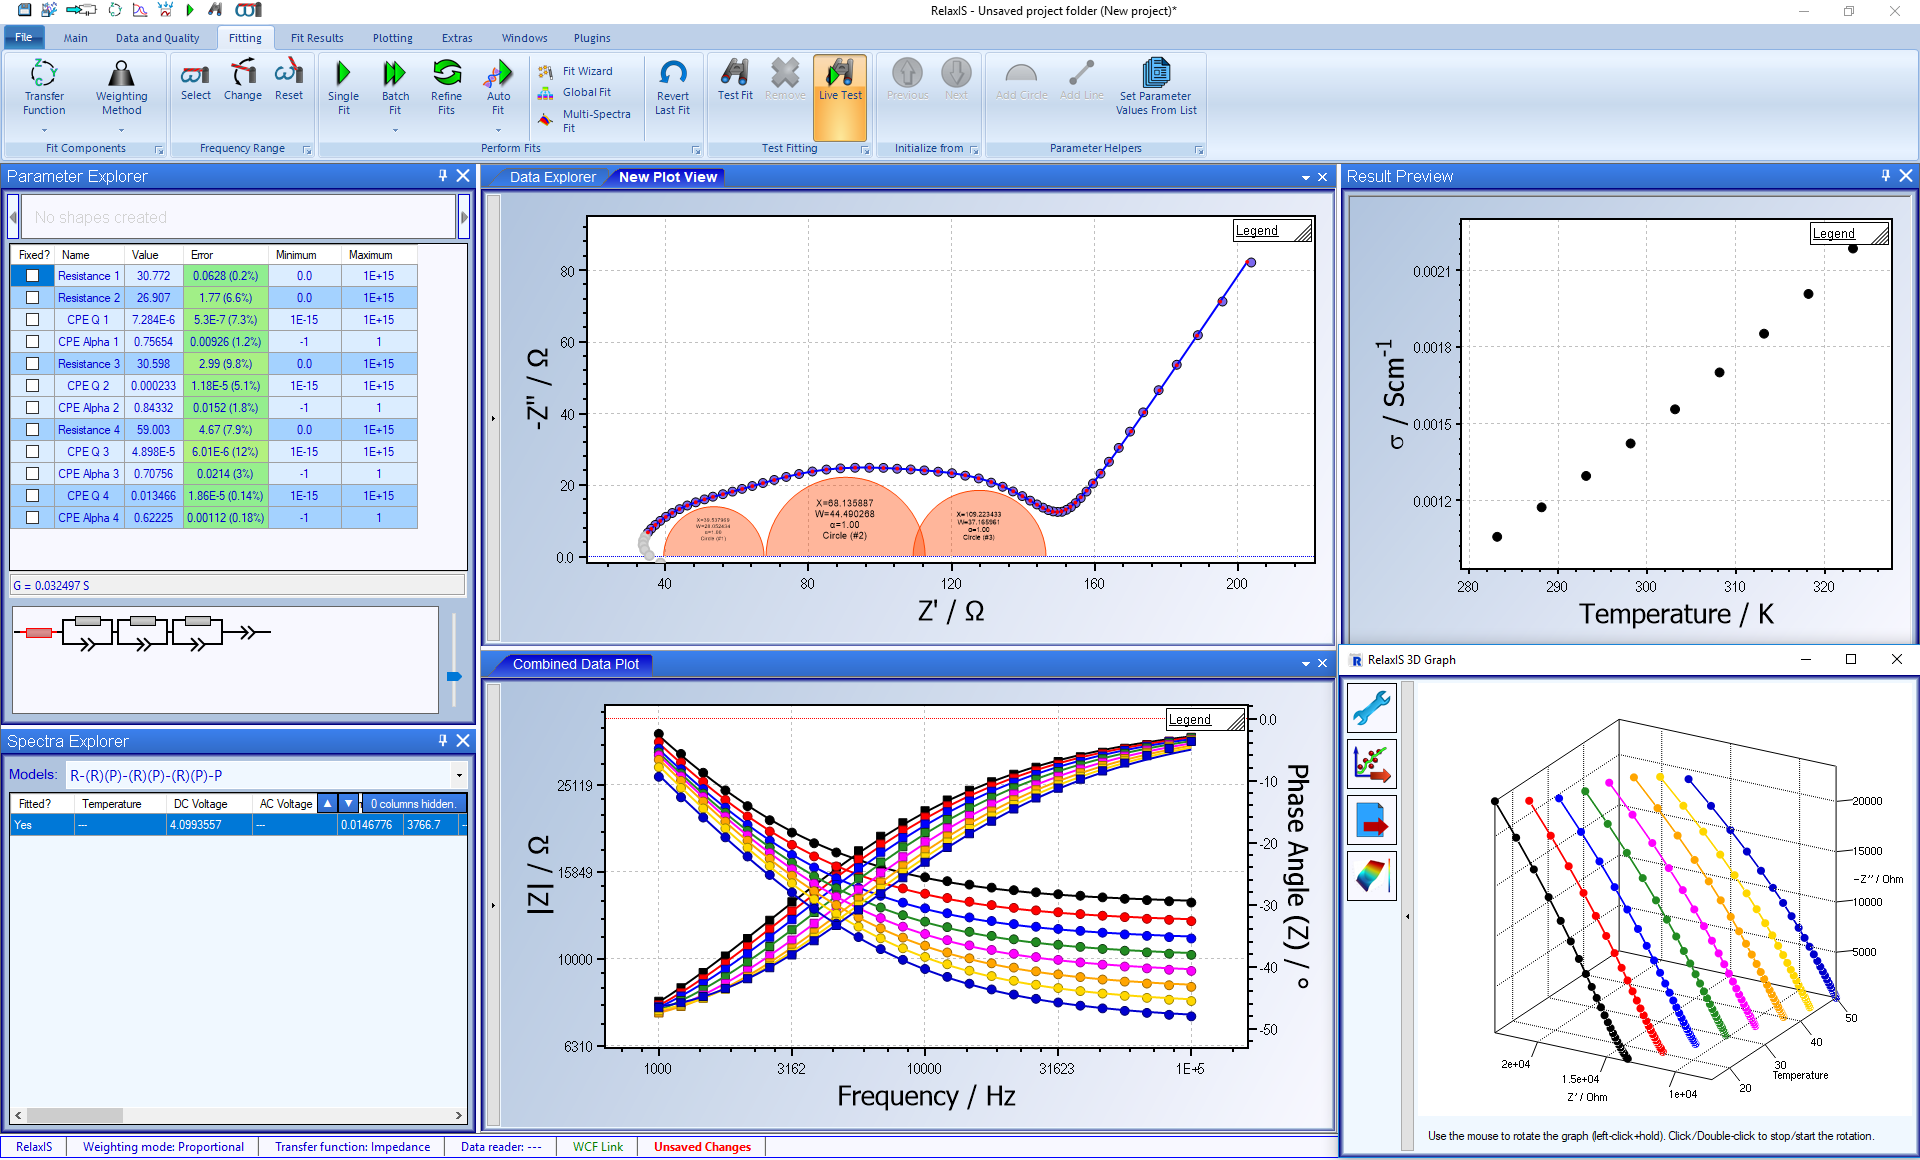
3D-Plot overlay of multiple spectra
Extensive library of pre-defined equivalent circuits
Simple derivation of initial values using the intuitive circle- or line-tool, or a genetic algorithm
Live preview of changes in the fit parameters
Test Fit function to preview the fit results
Batch fitting of several related spectra
Fit wizard for automated evaluation of particular types of spectra (e.g. conductivity measurements)
Multi-spectrum fits, i.e., "global parameters" or with parameters estimated from metadata-based
models.
Result Preview and Evaluation feature that allows the plotting and evaluation of the fit parameters
as a function of metadata
This implements Arrhenius- and VFT-Fits
Includes various other models
Built-in Mott-Schottky analysis of a series of spectra
RelaxIS Remote feature for autonomous evaluation and storage of impedance data
RelaxIS SDK that allows the enhancement of the basic features with plugins
Plugins are for example new file formats or circuit elements (and much more)
Integrated Code Editor to help with the developement of plugins
RelaxIS WCF Link feature for calling RelaxIS functions (i.e. fitting) from external software on the
same PC
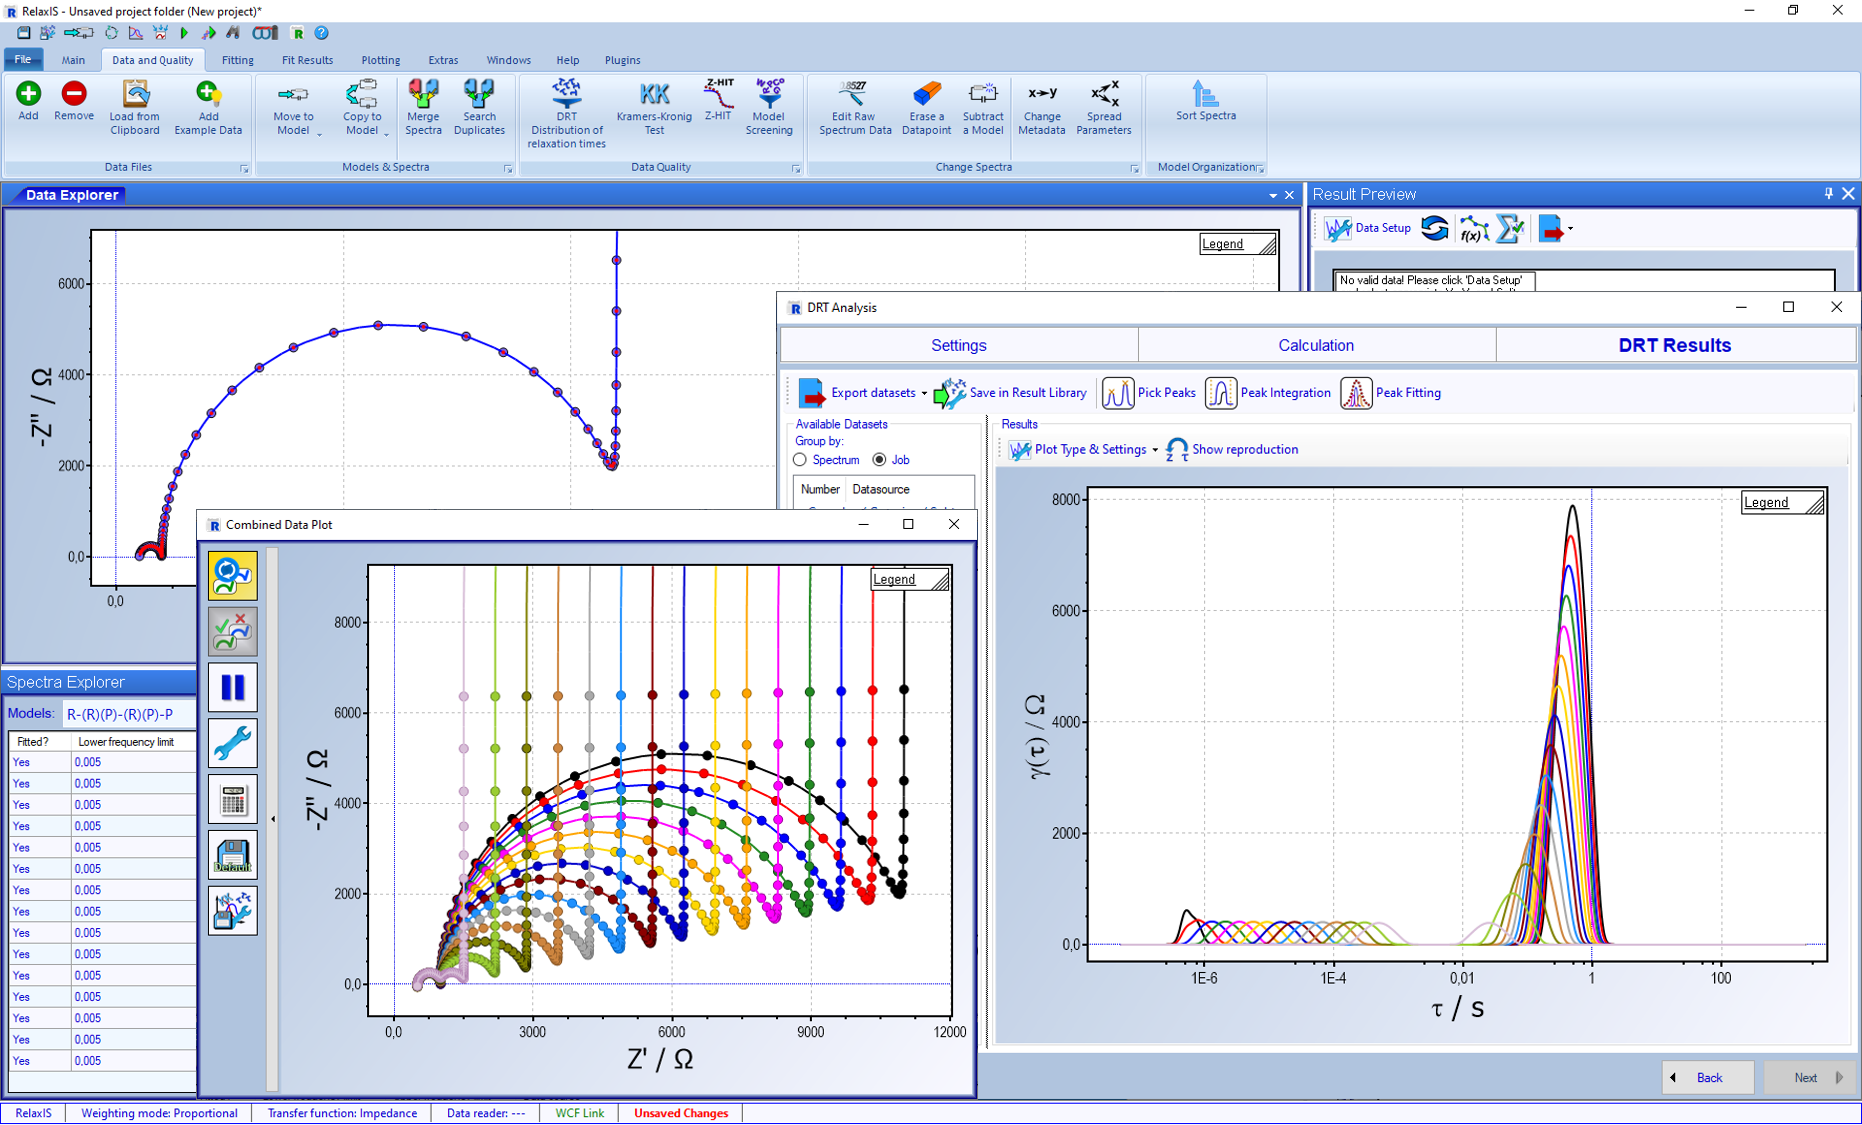
DRT (Distribution of Relaxation Times) Analysis
Linear Kramers-Kronig Test
Z-Hit calculation
Residual analysis and visualization
Circuit simulator for application in research and teaching
Define multiple models with separate, customizable parameter values
Freely change the simulated frequency range and number of datapoints
Customizable overlay plot of all simulated models
Ability to add normal-distributed noise to the data
Export-to-RelaxIS function to send simulated spectra to RelaxIS as data
Extensive export functions for every data type
Fit results
Impedance spectra with fits
Simulated spectra
Graphs as images
Images of Equivalent Circuits
Reporting feature that allows the creation of rich, HTML-based summarys of fit results
Licensing
Floating license - installation possible on multiple machines, simultaneous usage on one machine per
license.