
Impedance Measurement
The aim of impedance spectroscopy is to characterize the
electrical properties of devices or materials by the impedance function Z*(ω). It is defined by
the ratio of the voltage between two electrical ports of a
sample object and the resulting current through the ports.
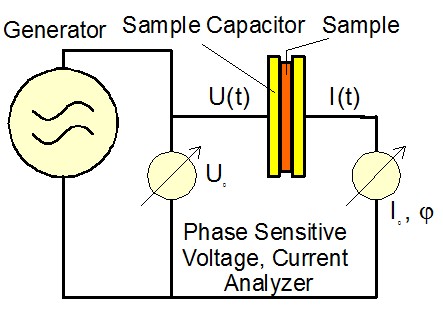
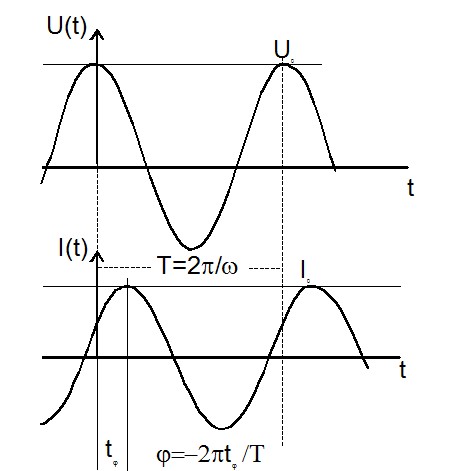
The ratio of U0 and I0 and the phase angle j are determined by the electrical properties of the sample. For simple calculation and representation of the formulas, it is convenient to use complex notation.
\begin{array}{lllll} \text{Voltage: }&U^*(t,\omega)&:=&U_0\cos(\omega t)&=&\Re[U^*(\omega) \exp(j\omega t)]\\ \text{Current: }&I^*(t,\omega) &:=&I_0 \cos(\omega t+\phi)& =&\Re[I^*(\omega)\exp(\omega t+\phi)]\\ \end{array} with \[ U^*=U'+jU'' \] and \[ I^*=I'+jI''; \; I_0=\sqrt{I'^2+I''^2}\;\mbox{; } \tan(\phi)=\frac{I''}{I'} \]where \( U^*, U', U'', U_0, I^*, I', I'', I_0 \text{ and } \phi \) all are frequency dependent. For a sample with linear electrical response, the ratio of U*(ω) and I*(ω) does not depend on the magnitude U0 of the applied voltage and the measurement result can be reduced to one complex function which can be defined by several basic representations. The most common one is the impedance
$$Z^*(\omega) = Z'(\omega)+jZ''(\omega)=\frac{U^*(\omega)}{I^*(\omega)}$$
Other often used representations are
\begin{array}{llll} \text{Admittance:} &Y^*(ω) &:=&\dfrac{1}{Z^*(ω)}\\ \text{Capacity:} &C^*(ω) &:=&\dfrac{1}{jωZ^*(ω)}\\ \text{Inductance:} &L^*(ω) &:= &\dfrac{Z^*(ω)}{jω}\\ \end{array}These representations show the following properties.
For an ideal resistor or conductor with resistance R and conductance S=1/R, Z*(ω) = R, and Y*(ω) = S.
For an ideal capacitor with capacity C0, C*(ω) = C0. If a material is placed between two electrodes, C*(ω) is directly proportional to the complex material permittivity ε*(ω).
For an ideal inductor with inductance L0, L*(ω) = L0. If a material is placed into an inductive coil, L*(ω) is directly proportional to the complex material permeability µ*(ω).
and vectors for ideal resistor, capacitor, inductor.
The used representation depends on the sample type and the personal preference of the researcher. In practice, samples are never ideal. Nevertheless, one generally selects a representation close to the electrical sample type. E.g. a mainly capacitive sample generally is represented in terms of C*(ω). Independent of the actual representation, one should keep in mind that they all contain the same information, i.e., the sample response current to an applied voltage.
Other types of frequently used representations are defined as ratios of real and imaginary parts of the complex data representations shown above. These are the loss factor \[ \tan \delta := -\frac{Z'(\omega)}{Z''(\omega)}=-\frac {C''(\omega)}{C'(\omega)} \] and the phase factor \[ \tan\phi=\frac{1}{\tan\delta} \]| Case | φ | tan(φ) | δ | tan(δ) |
|---|---|---|---|---|
| Ideal resistor | 0° | 0 | 90° | ∞ |
| Ideal capacitor | -90° | -∞ | 0° | 0 |
| Ideal inductor | 90° | ∞ | 180° | 0 |
In impedance spectroscopy, Z*(ω) is measured over a broad
frequency range e.g. from mHz to several GHz in order to obtain as much
information as possible.