Dielectric Spectroscopy and Impedance Spectroscopy of Materials
The aim here is to characterize the electric or magnetic properties of materials by the impedance spectrum Z*(ω). To this end, the material is placed into a sample cell. Electrical characterization is performed by measuring the complex permittivity spectra ε*(ω) and conductivity spectra σ*(ω). These are related to the dynamics of charge transport and dipole reorientation in the material.
Usually, materials contain both free charge carriers (electrons, ions) and charge carriers bound in molecules. If the electrical properties are dominated by the free charge carriers, they are classfied as conductors, otherwise as dielectric materials. If an electric field E is applied to a material, the free charge carriers will move through it, and the polar molecules will partly be oriented in the direction of the field. This is described by the current density js or the polarization Ps.
\[ j_s:=\frac1A\frac{\partial Q_\mathrm{transfer}}{\partial t} \] \[ P_s:=\frac{Q_\mathrm{separate}}{A} \]For the free charge carriers, A is the area crossed by the charge dQtransfer within time dt. For the molecules, A is the area which separates the amount of charge Qseparate due to the oriented dipoles.
After a sufficient time, the current density and the polarization will become constant in time, and the material will be in a static state. In this case the static material constants conductivity σs and permittivity εs can be defined by
\[ \sigma_s:=\dfrac{j_s}{E} \] and \[ \epsilon_s:=\dfrac{P_s}{\epsilon_0E}+1 \]They describe the current density or polarization response of a material with respect to the electric field.
After the electric field is applied to the material, the free charge carriers will not imediately reach their final speed and the molecules will need a certain time for orientation. As a result all quantities defined above will become time dependent.
\begin{eqnarray} j_s&\to& j(t)\\ P_s&\to& P(t)\\ \sigma_s&\to&\sigma(t)\\ \epsilon_s&\to&\epsilon(t) \end{eqnarray}This time dependence is called charge or molecular relaxation. It can be directly measured by time domain spectroscopy methods, where the flow of charge is measured as a function of time after switching on the electric field.
In most cases, however, data are measured and evaluated in the frequency domain, which offers three major advantages.- Data can be measured more accurately and over a much larger conductance and permittivity range.
- Relaxation phenomena are decribed in the time domain by linear differential equations, whereas the corresponding frequency representation contains simpler algebraric terms with power laws in frequency. The frequency and time domain representations in principle contain the same information and are linked by Fourier Transforms.
- Data directly link up with other spectrocopy techniques in the optical and UV range.

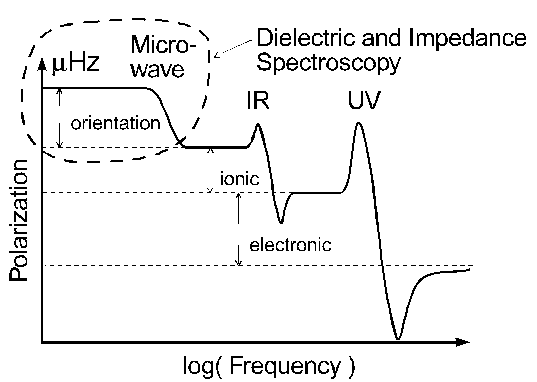
Fig. Typical frequency range of charge relaxation and resonance effects.
In a frequency domain measurement, the step-wise change of the electric field applied to the material is replaced by a sinusoidal signal of fixed frequency \(\omega/(2\pi)\). The material's response is an oscillating charge of the same frequency. If in the equations above, the static field is replaced by a periodic field, we get
\begin{eqnarray} j^*(\omega)&=&\dfrac{j\omega Q^\ast(\omega)}{A}\\ P^*(\omega)&=&\dfrac{\omega Q^*(\omega)}{A}\\ \sigma^*(\omega)&=&\dfrac{j^*(\omega)}{E^*(\omega)}\\ \epsilon^*(\omega)&=&\dfrac{P(\omega)}{\epsilon_0E^*(\omega)}+1 \end{eqnarray}The current density j*(ω) should not be confused with imaginary unit j.
In both frequency and time domain measurements, the problem arises that both dipoles and free charge carriers will contribute time or frequency dependent charge parts.
In the equations above, the free charge carrier response Q*transfer(ω) is shifted by 90° with respect to the driving field, whereas the dipole charge response Q*separate(ω) is in phase with the field. Therefore, in principle, the contributions can be separated by phase. In practice, however, this works only if the frequency is sufficiently low so that dynamic effects of the free charge or dipole response related to their mass can be neglected. The materials electrical response is then frequency-independent and Re(ε*(ω)) = εs, Re(σ*(ω)) = σs (static case).
If dynamic effects become relevant, dipole relaxation is always damped resulting in a non-zero phase shift of Q*separate(ω) against E*(ω). In addition, the free charge carrier response often shows a deviation from the ideal 90° phase shift of Q*transfer against E*(ω). This may become relevant in the frequency range of dielectric or impedance spectroscopy especially for ions with a large mass and for molecular dipoles.
In a single frequency measurement, the two contributions, in general, cannot be separated and thus sum up to the total measured charge oscillation
\[ Q^*(\omega)=Q^*_\mathrm{transfer}(\omega)+Q^*_\mathrm{separate}(\omega) \]used in the equations above. As a result, both ε*(ω) and σ*(ω) (and j*(ω) and P*(ω)) refer to the total charge and contain the same information, including both mobile charge carrier and dipole response information. In this sense, ε*(ω) and σ*(ω) are simply different representations of the materials charge response to an electric field.
For purely conductive materials (e.g, metals) or pure dielectrics (e.g., silica), the relaxation is fast and and the relaxation times thus outside the measurement range of dielectric or impedance spectroscopy. In many other materials, however, the motion of mobile charge carriers or molecules is hindered by, e.g., the material's viscosity. In these cases, the relaxation times are often in the range from some 10 ps to weeks. This translates to frequencies from µHz to some GHz and is, therefore, accessible to dielectric or impedance spectroscopy. This statement applies in particular to the case of polymer materials where the molecular dynamics is hindered by the entanglement of the molecular chains.
