
Thermally Stimulated Depolarization Current
TSDC System - General Features
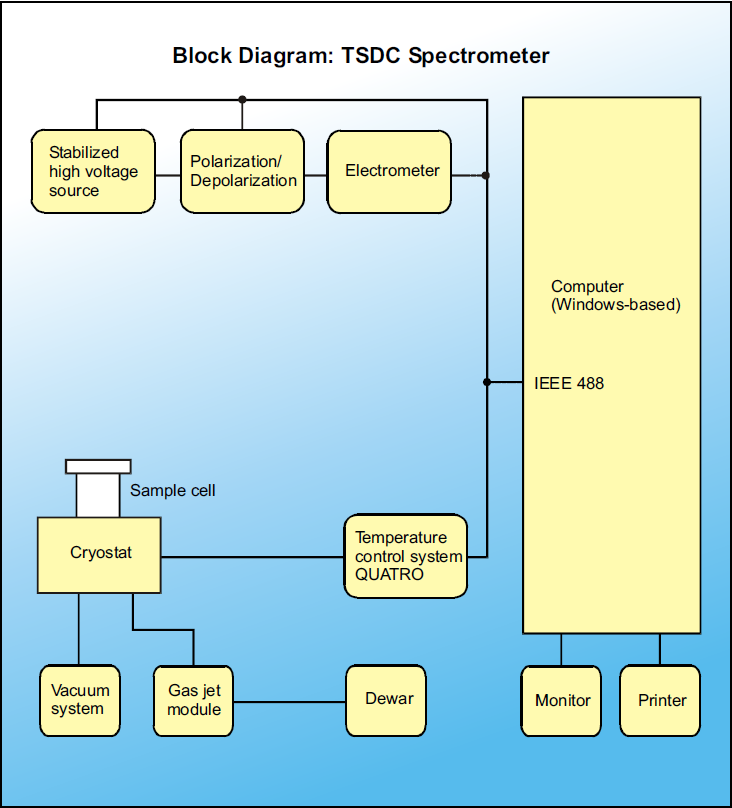
All TSDC measurements are computer-controlled by the Windows-based software WinTSC. The program operates the polarization voltage source, the polarization-depolarization mode switches, the high sensitive and fast electrometer for sensing the depolarization current and several temperature control systems. Nearly any kind of TSDC experiment can be programmed by a flexible experiment set-up procedure. The experiment is defined by a series of time intervals. During each time interval, the polarization voltage and temperature is either defined as fixed value or with a continuous change in time (ramp). The system may be switched in each time interval between the polarization and depolarization current measurement mode. In addition to this general experiment set-up mode, predefined set-ups like e. g. batch modes for series of TSDC sweeps with different heating rates are supported as well.
The basic TSDC parameters, like depolarization current as a function of temperature are evaluated and graphically displayed in single or multicurve representation and exported numerically. In another representation, the experiment state defined by polarization voltage, temperature and depolarization current is shown as a function of time.
Optional Thermal Windowing
In addition to the standard TSDC functions, the thermal windowing technique can be performed by the TSDC system, which is requiring additional experiment conditions and optional software.
It supports data manipulation functions like shifting, deleting of data points, and confining and smoothing of data curves. The main function of this software is the evaluation of relaxation maps from a thermal windowing experiment. The sample polarization is calculated by numerical integration from the measured depolarization current. Several procedures for integration and base line corrections are supported. After the conversion of the polarization and depolarization current into the relaxation time, the common relaxation maps are created. They show the single Debye relaxation modes in several representations like e. g. Arrhenius or a free energy diagram. Several curve fitting model functions like Arrhenius, Vogel Fulcher and Williams Landel Ferry (WLF) for the relaxation time data are supported.
Example processes studied by TSDC technique
- Ageing (Polymers and ceramics)
- Charge carriers trapping, density and mobility
- Bulk thermal relaxations
- Interfacial relaxations
- Defects