
Alpha analyzer Measurement Example
Capacity and loss factor tan(δ) of an air capacitor and low loss polyethylene.
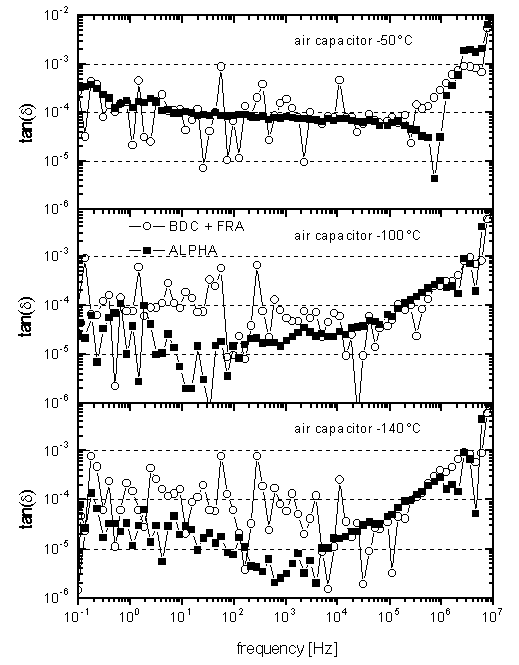
As a low loss test sample, an air capacitor mounted in the sample cell of each system was used. It was prepared from parallel gold plated electrodes with 30 mm diameter. The electrode distance was adjusted to 50 mm by two silica spacer rods resulting in about 125 pF capacity.
Due to the conductance of the rods, the capacitor shows especially at ambient temperature remaining losses. By cooling the capacitor to low temperatures, the conductivity of the spacer rods decreases and the losses are continuously reduced. This kind of capacitor is well suited for testing the tan(δ) accuracy and resolution of dielectric analysis systems. Results for three different temperatures are shown in Fig. 1.
At −50 °C and frequencies above 10 Hz, the capacitor losses are approx. tan(δ) ≈ 10-4. At lower frequencies tan(δ) increases to about 3.10-4 at 0.1 Hz. This dependence can be measured without significant noise by the Alpha analyzer at frequencies below 100 kHz.
For comparison, the results of a typical dielectric test system based on a device combination of the Novocontrol Broadband Dielectric Convert BDC + a frequency response analyzer (FRA) shows the same dependency, but superimposed by about 100% noise due to the system resolution limit tan(δ) of 10-4 which is in the same order as the sample loss.
If the temperature is lowered to −100 °C and −140 °C, the capacitor losses decrease further and the better resolution limit of the Alpha analyzer is the limiting factor as shown in the lower two diagrams of Fig. 1. Compared to the BDC + FRA combination, the resolution is improved from 10-4 to 10-5. At the high frequency end above 100 kHz, the results show an increase in tan(δ) which is not intrinsic to the sample, but due to high frequency limitations for both systems. At 10 MHz, the accuracy is decreased to about tan(δ) ≈ 0.01 corresponding to about 1° phase accuracy.
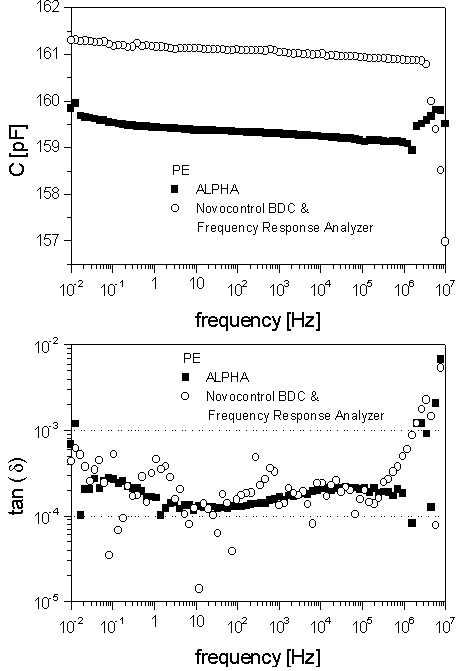
Fig. 2 shows similar measurements for a low loss Polyethylene sample at ambient temperature. The sample capacity is about 160 pF and in good agreement for both systems. The difference of about 1% in the absolute value is due to stray capacities and mounting deviations of the different sample cells. The tan(δ) of the sample is between 10-4 .. 3.10-4. The results of the two measurement systems show the same behavior as for the low loss capacitor. Whereas for the BDC + FRA combination the phase resolution limit is reached, the results can be resolved with only 10% scatter by the Alpha. The tan(δ) increase at high frequencies is again due to internal limitations of both systems. This limitation can be seen in the capacity, too. The deviations at 10 MHz are about 1.5 pF for the Alpha and about 8 pF for the BDC + FRA combination.