Alpha-A Analyzer Measurement Examples
Broadband Dielectric Spectra of PVDF
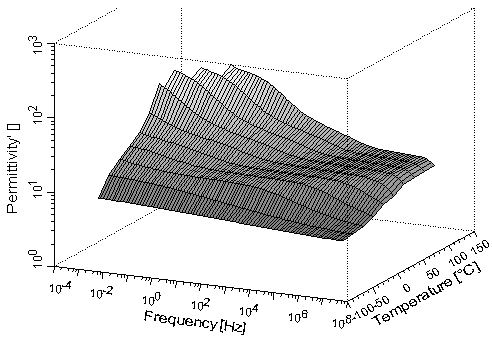
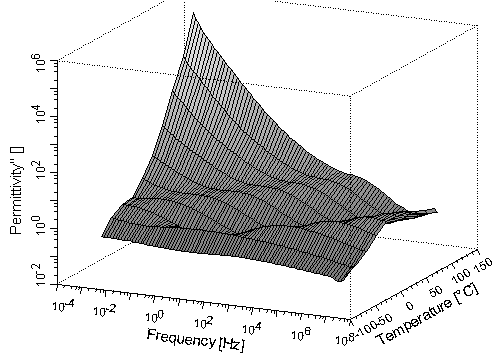
The measurement results shown in Figs. 1-4 were obtained using an Alpha-ANB analyzer with ZGS active sample cell test interface and a Quatro Cryosystem system for temperature control. In order to demonstrate the overall system performance, PVDF was chosen as a material with not too low losses. Figs. 1 and 2 show the dielectric spectrum at frequencies from 1 mHz to 10 MHz at several temperatures.
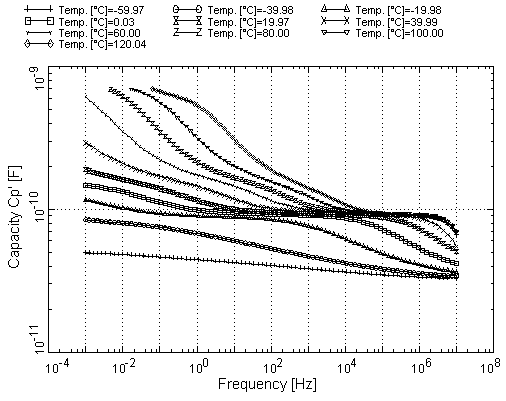
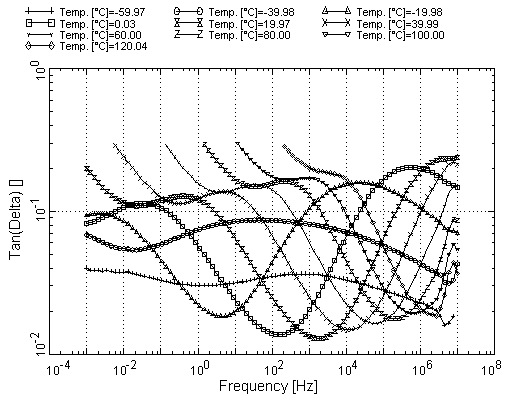
PVDF shows α and β relaxations with tan(δ) losses in the range from 0.01 to 0.2. At higher temperatures, DC conductivity creates low-frequency increase of ε''. As shown in the three-dimensional diagrams, the data could be measured over the entire frequency and temperature ranges nearly without artefacts. In order to show the data in more detail, the diagrams for capacity and tan(δ) in Fig. 3, 4 were confined to the range of interest.