
Alpha-A
Wide impedance range measurement examples
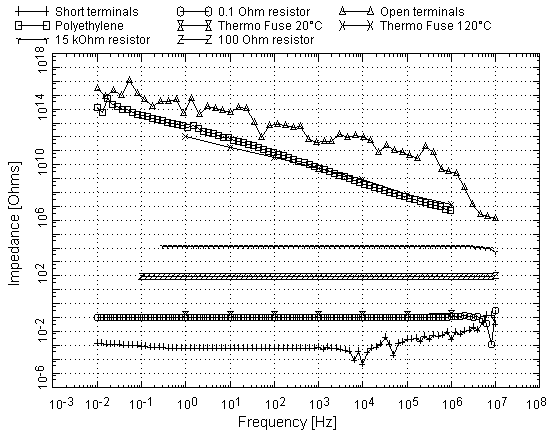
The typical available impedance range over frequency is shown in Fig. 1.
For the low impedance range, data are shown for a short on the ZG2 interface impedance inputs. As can be seen typical limit is about 1 mΩ below 100 kHz and with this about a factor 10 below the specification which is 10 mΩ. In addition, the results for 3 resistor components with 0.1 Ω, 100 Ω and 15 kΩ are shown. The measured data show the expected flat frequency independent shape nearly over the entire frequency range. Some resistor data were not measured to low frequencies for time saving reasons. The Alpha accuracy in the "low impedance" range (e.g. below 10 MΩ) is independent of frequency and constant down to lowest frequencies.
In the Fig. 1 upper diagram, data of the open ZG2 interface impedance terminals are shown. They indicate the typical high impedance limit. It should be noted that at low frequencies the overall typical impedance range is from about 1 mΩ to 1 PΩ and covers 18 orders of magnitude. For comparison, the parallel resistance of a Polyethylene sample is shown. Polyethylene is one of the highest isolating lowest loss polymer materials with a loss factor tan(δ) around 2⋅10-4.
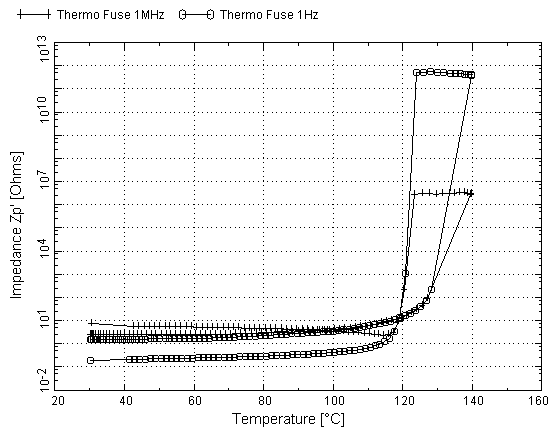
Fig. 2 shows the parallel impedance of a Polymer composite material with a metal filler compound. The sample was supplied by ABB Switzerland Corporate Research. The material is used in electronic thermal fuses.
At ambient temperature there is a connection between the metal grains and the material is a strong conductor with an impedance around 0.1 Ω.
If the temperature is increased to about 120 °C, the percolation paths between the metal grains start to break due to thermal expansion of the polymer matrix and the material becomes a good isolator with an impedance of 1012 Ω at low frequencies. At 1 MHz, the impedance decreases due to dielectric relaxation of the polymer material, but the impedance is with 3 MΩ still high. If the temperature is lowered once again, the conductive properties are restored showing the process is reversible.
As can be seen from Fig. 2, the impedance changes at low frequencies by about 13 orders of magnitude within a single sample. The frequency response of the material at fixed temperatures is shown in Fig. 1 for comparison.